Search and compare data from the California School Dashboard, 2025
The California School Dashboard shows achievement and progress, or lack of it, on multiple measures in color codes tied to performance metrics. Enter a search term in the box below to search by school, city, district or county. Click on colored dots to get detailed metrics. Test scores are available on cells with an “i.” If a school or district does not appear, it means that no data is available.
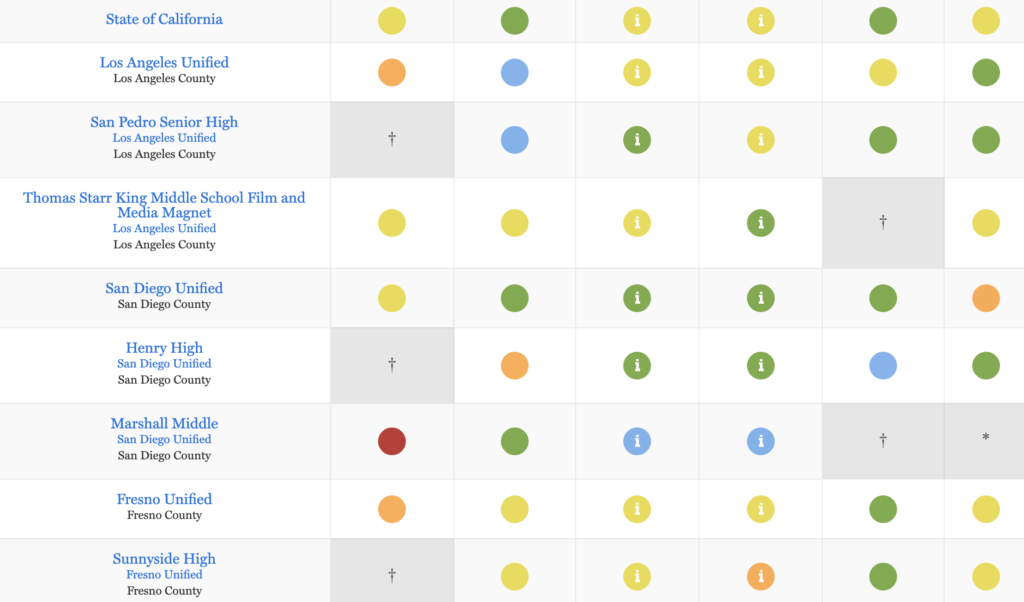
| School Name, City and County | Chronic Absenteeism Rate | Suspension Rates | English Language Arts Performance | Math Performance | High School Graduation Rate | English Learners | Link |
|---|---|---|---|---|---|---|---|
| School Name, City and County | Chronic Absenteeism Rate | Suspension Rates | English Lang. Arts Performance | Math Performance | High School Graduation Rate | English Learners | Link |

Notes to Database
The above table shows school and district data released Nov. 13, 2025 by the California Department of Education. You can also view EdSource’s presentation of dashboard data for 2024, 2023, 2019, 2018 and 2017. (Missing or incomplete years of data from the California School Dashboard are due to the disruptions caused by the pandemic.)
Color Codes and Ratings: The dashboard includes five color-coded performance levels, based on a combination of current performance level and change over the previous year. The color spectrum ranges from red to orange to yellow to green to blue, with red signifying the lowest performance level and blue the highest.
More information about how the performance levels were calculated is available at the California Department of Education’s website here.
Column Headings:
Chronic Absenteeism: Proportion of students who miss 10% or more of expected days of attendance in a school year. (For a student enrolled for 180 days, this would be 18 or more days.) Note: This indicator is not reported for high schools.
Suspension Rates: Based on a combination of current suspension rates and changes in those rates over time.
English Language Arts Performance: Student performance in grades 3-8 and 11 on the English Language Arts Smarter Balanced tests administered in the current year, combined with whether scores improved, declined, or stayed the same compared to the previous year.
Math Performance: Student performance in grades 3-8 and 11 on the math Smarter Balanced tests in the current year, combined with whether scores improved, declined, or stayed the same compared to the previous year.
High School Graduation Rate: Combined four-year and five-year graduation rates, including the current graduation rate, along with whether rates have changed over the previous year.
For more information about how the performance levels were calculated, go to the California Department of Education’s website here.
For the full dashboard for each school or district, go here.